
Photos, Measurements & Performance
Progress in bodybuilding is rarely captured by a single signal. Photos, body measurements, and performance trends each describe a different layer of adaptation, and none of them work well in isolation. Used together, they provide a more complete picture of what is actually changing over time.
This content explains what each of these indicators reflects, why they often disagree, and how to interpret them as complementary sources of information rather than competing measures.
This content is educational, not medical advice.

What Progress Photos Are Good At Showing
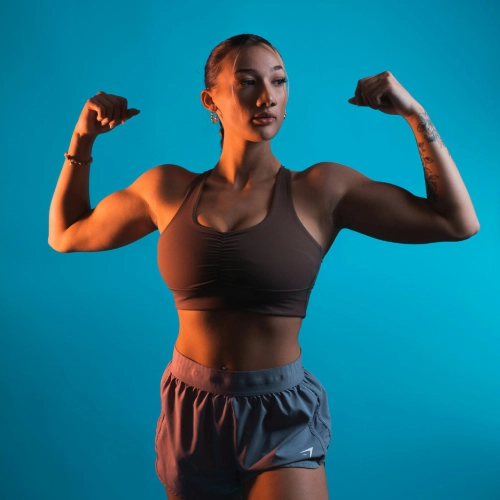
Progress photos capture visual changes that numbers often miss. Muscle shape, proportion, and definition tend to appear in photos before they show up in measurements or scale weight.
Photos are particularly useful for observing:
- Changes in fat distribution
- Muscle fullness and separation
- Postural and structural differences
However, photos are sensitive to conditions. Lighting, camera angle, distance, and posture can exaggerate or hide change. This makes consistency more important than frequency when using photos as a progress tool.
What Measurements Actually Track
Body measurements aim to quantify size rather than appearance. Circumference measurements can reflect changes in muscle mass or fat storage depending on context.
Measurements tend to respond more slowly than photos because:
- Tissue changes accumulate gradually
- Small shifts may fall within measurement error
- Short-term fluctuations are often masked
Research suggests that measurements are more useful for identifying long-term trends than for confirming short-term progress.
Performance as a Signal of Adaptation
Performance reflects how well the body tolerates and responds to training stress. Improvements in strength, control, or work capacity often indicate positive adaptation even when visual change is subtle.
Performance trends can reveal:
- Increased load tolerance
- Better movement efficiency
- Improved recovery between sessions
These changes frequently precede visible hypertrophy, which is why performance is often one of the earliest indicators of progress.
Why These Signals Rarely Align Perfectly
It is common for photos, measurements, and performance to move out of sync.
For example:
- Performance improves while appearance stays similar
- Photos show change before measurements shift
- Measurements change while performance temporarily stagnates
This mismatch does not indicate failure. It reflects the fact that different tissues adapt on different timelines.
The Risk of Relying on Only One Indicator
Using a single progress marker turns natural variability into perceived problems.
Photos alone may exaggerate day-to-day changes. Measurements alone may miss early adaptation. Performance alone may improve without visible change for extended periods.
Combining signals reduces the likelihood of misinterpretation and helps distinguish real trends from short-term noise.
Interpreting Progress Over Time, Not Moments
Meaningful adaptation is cumulative. Individual data points rarely tell the full story.
Progress becomes clearer when:
- Photos are compared under similar conditions
- Measurements are tracked across longer intervals
- Performance trends are viewed across multiple training cycles
This approach aligns expectations with biological reality rather than short-term feedback.
Progress as Context, Not Confirmation
Photos, measurements, and performance are not verdicts. They are context.
When viewed together, they explain why progress can feel invisible before it becomes obvious. Understanding how these indicators interact helps clarify why adaptation often shows up in stages rather than all at once.
This perspective connects naturally with how progress interpretation is discussed in Measuring Progress Correctly and how visual change and numerical signals are compared in Scale Weight vs Mirror.
This content is educational, not medical advice.
Scientific Sources
Schoenfeld BJ (2010). The Mechanisms of Muscle Hypertrophy and Their Application to Resistance Training.
https://pubmed.ncbi.nlm.nih.gov/20847704/
Gallagher D, Heymsfield SB, Heo M, Jebb SA, Murgatroyd PR, Sakamoto Y (2000). Healthy Percentage Body Fat Ranges: An Approach for Developing Guidelines Based on Body Mass Index.
https://pubmed.ncbi.nlm.nih.gov/10966886/